1 Scientific research
1.1 Mechanical Vibration (General)
Mechanical vibrations is a matter that always concern engineers and vehicles designers, as their effect can cause fatigue and damages to the structure. Besides metal structures effects, vibrations (shocks) can also cause health problems.
Rough sea and waves are capable to create mechanical vibrations to sea vehicles. By extension, high speed crafts (HSC) have an increased possibility to deal with mechanical shocks due to the higher moving speed. Even a small wave on high speed can cause a huge shock to the boat structure and the crew. Several studies have been performed along years in order to eliminate these vibrations using shock absorbing systems.
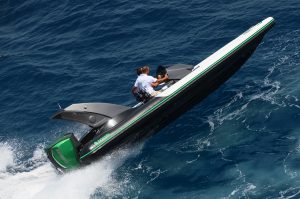
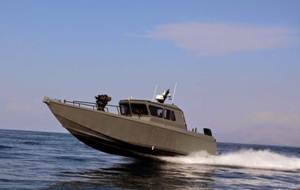
1.2 Vibrations on high speed crafts (HSC)
High-speed craft is a craft capable of a maximum speed, in metres per second (m/s), equal to or exceeding 3.7 times the one-sixth power of the volume of displacement corresponding to the design waterline (m³), excluding craft the hull of which is supported completely clear above the water surface in non-displacement mode by aerodynamic forces generated by ground effect. (SOLAS X/1.2, HSC Code 2000 para 1.4.30)and they can be used to serve civilian or military needs.
|
|
|
An HSC has always to deal with shocks due to the crash with sea water. These impacts cause problems not only in vessel’s infrastructure, but also in crew’s health. These effects are augmented when a crew member keeps using the HSC for a long time in his life.
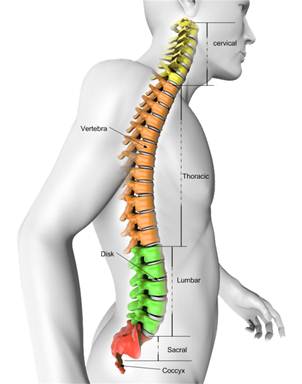
The reason that sea waves shocks can have health effects is the compression of lumbar spine, for both peoples with normal health and for peoples with spine disorders like osteoporosis.
Some health effects caused by lumbar spine compression due to multiple shocks created by sea waves impact on HSC are:
1. Damages in lower lumbar spine and connected nervous system
2. Damages in lumbar vertebral endplates
3. Scoliosis
4. Pain
5. Lumbar spines traumas that affect spine structure and can cause spine collapse
1.3 The need of shock absorbers on high speed crafts (HSC)
Using specially designed HSC seats with shock absorbing mechanisms, the hazardous vibrations can be eliminated up to a safer level for the health of the passenger.
The difference between a plain seat and a specially designed HSC seat is not the seat by itself, but the standing mechanism. The "heart" of the mechanism is a shock absorber which mitigates the mechanical impacts caused by sea waves on high speed sailing. The largest of the amount of potential energy that derives from wave impact is absorbed by the shock absorber, which allows the standing mechanism to oscillate and convert this energy to kinematic (standing mechanism oscillation) and thermal (inside absorber’s pressurized liquid, e.g. nitrogen). A very small amount of potential energy is driven to seat pad and vibrates the seated human. Even this small vibration can have health effects, but far less than when a specially designed standing mechanism is absent.
|
Suspension Ver PL |
Suspension Ver MIL |
1.4 Test results in accordance ISO 2631-5
Two different systems, Suspension Ver MIL (Military) and Suspension Ver PL (Pleasure), with two different types of shock absorbers (type 1 & type 2), were tested in a specially designed test-bed. These systems are designed and manufactured by EMAL® SA for the need of "Ermioni HSC Seats".
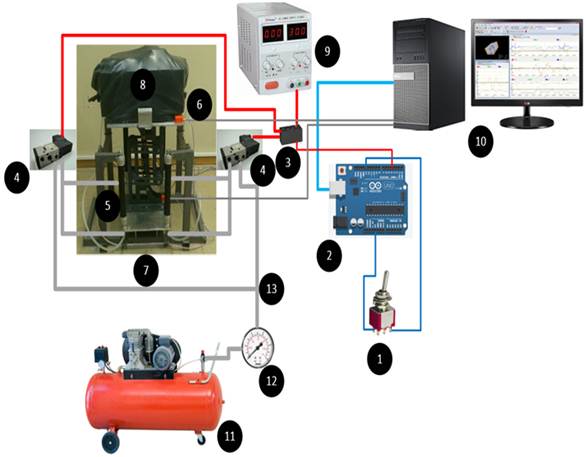
Input data:
Continuous pulse mechanical vibration inputs for a duration of 30 seconds.
Frequencies from 5 Hz to 30 Hz with an increment of 5 Hz
Input accelerations from 2 to 4 g at base platform.
Measurements at base platform and seat pad
Output data:
Calculations of Se, Sed and R values for each frequency.
Se: equivalent static compressive stress in the spine
Sed: equivalent static compression dose, normalized to an 8 – hour per day operation
R: Assessment factor, normalized for 240 days per year usage, starting from an age of 20 years old and finishing at an age of 65 years old.
Plots of response at z axis
Notes:
The factor R can be defined for use in the assessment of the adverse health effects related to the human response acceleration dose.
|
0.5 < R < 0.8 |
0.8 < R < 1.2 |
R > 1.2 |
|
Low risk for lumbar spine injuries |
Moderate risk for lumbar spine injuries |
High risk for lumbar spine injuries |
1.4.1 Suspension Ver MIL with type 1 shock absorber
|
Frequency in Hz |
Average base peak acceleration in g* |
Average seat peak acceleration in g* |
Average lumbar spine peak acceleration in g* |
|
in MPa |
R |
Risk for lumbar spine injuries |
|
5 |
3.2 |
1.3 |
1.15 |
0.019619 |
0.059621 |
0.093267 |
LOW |
|
10 |
3.1 |
1.3 |
1.15 |
0.018323 |
0.055856 |
0.087377 |
LOW |
|
15 |
4 |
1.4 |
1.2 |
0.019243 |
0.05857 |
0.091623 |
LOW |
|
20 |
3.5 |
1.4 |
1.15 |
0.015081 |
0.046222 |
0.072307 |
LOW |
|
25 |
2.8 |
1.6 |
1.15 |
0.023578 |
0.072536 |
0.11347 |
LOW |
|
30 |
3 |
1.5 |
1.1 |
0.028148 |
0.093799 |
0.14673 |
LOW |
*Acceleration measurements refer to z axis.
Table 1. Laboratory tests for Suspension Ver MIL with type 1 shock absorber, at continuous pulse type mechanical vibrations.

Figure 1. ![]() ,
,![]() and R values plot with low
regression error (
and R values plot with low
regression error (![]() for Suspension Ver MIL with type
1 shock absorber.
for Suspension Ver MIL with type
1 shock absorber.
1.4.2 Suspension Ver MIL with type 2 shock absorber
|
Frequency in Hz |
Average base peak acceleration in g* |
Average seat peak acceleration in g* |
Average lumbar spine peak acceleration in g* |
|
in MPa |
R |
Risk for lumbar spine injuries |
|
5 |
2.8 |
1.2 |
1.1 |
0.017244 |
0.055794 |
0.087281 |
LOW |
|
10 |
2.8 |
1.3 |
1.1 |
0.017347 |
0.056329 |
0.088117 |
LOW |
|
15 |
3.4 |
1.4 |
1.2 |
0.024679 |
0.080145 |
0.12537 |
LOW |
|
20 |
3 |
1.4 |
1.15 |
0.022671 |
0.073434 |
0.11488 |
LOW |
|
25 |
2.5 |
1.3 |
1.1 |
0.02095 |
0.083825 |
0.13113 |
LOW |
|
30 |
2.2 |
1.3 |
1.1 |
0.023029 |
0.094667 |
0.14809 |
LOW |
*Acceleration measurements refer to z axis.
Table 2. Laboratory tests for Suspension Ver MIL with type 2 shock absorber, at continuous pulse type mechanical vibrations.

Figure 2. ![]() ,
,![]() and R values plot with low
regression error (
and R values plot with low
regression error (![]() for Suspension Ver MIL with type
2 shock absorber.
for Suspension Ver MIL with type
2 shock absorber.
1.4.3 Suspension Ver PL with type 1 shock absorber
|
Frequency in Hz |
Average base peak acceleration in g* |
Average seat peak acceleration in g* |
Average lumbar spine peak acceleration in g* |
|
in MPa |
R |
Risk for lumbar spine injuries |
|
5 |
2.8 |
1.3 |
1.2 |
0.022061 |
0.072941 |
0.1141 |
LOW |
|
10 |
3.3 |
1.3 |
1.15 |
0.022435 |
0.073275 |
0.11463 |
LOW |
|
15 |
3.8 |
1.4 |
1.15 |
0.019082 |
0.064471 |
0.10085 |
LOW |
|
20 |
4.2 |
1.5 |
1.2 |
0.025195 |
0.08315 |
0.13008 |
LOW |
|
25 |
2.8 |
1.5 |
1.15 |
0.032176 |
0.10876 |
0.17013 |
LOW |
|
30 |
2.6 |
1.3 |
1.1 |
0.033677 |
0.11039 |
0.17268 |
LOW |
*Acceleration measurements refer to z axis.
Table 3. Laboratory tests for Suspension Ver PL with type 1 shock absorber, at continuous pulse type mechanical vibrations.

Figure 3. ![]() ,
,![]() and R values plot with low
regression error (
and R values plot with low
regression error (![]() for Suspension Ver PL with type
1 shock absorber.
for Suspension Ver PL with type
1 shock absorber.
1.4.4 Suspension Ver PL with type 2 shock absorber
|
Frequency in Hz |
Average base peak acceleration in g* |
Average seat peak acceleration in g* |
Average lumbar spine peak acceleration in g* |
|
in MPa |
R |
Risk for lumbar spine injuries |
|
5 |
2.8 |
1.35 |
1.2 |
0.018519 |
0.060363 |
0.094429 |
LOW |
|
10 |
2.9 |
1.3 |
1.15 |
0.018739 |
0.060486 |
0.09462 |
LOW |
|
15 |
2.6 |
1.3 |
1.1 |
0.022345 |
0.070211 |
0.10983 |
LOW |
|
20 |
2.6 |
1.25 |
1.15 |
0.02326 |
0.075059 |
0.11742 |
LOW |
|
25 |
2.5 |
1.35 |
1.1 |
0.032763 |
0.12168 |
0.19035 |
LOW |
|
30 |
2.5 |
1.3 |
1.1 |
0.034091 |
0.12913 |
0.20201 |
LOW |
*Acceleration measurements refer to z axis.
Table 4. Laboratory tests for Suspension Ver PL with type 2 shock absorber, at continuous pulse type mechanical vibrations.

Figure 4. ![]() ,
,![]() and R values plot with low
regression error (
and R values plot with low
regression error (![]() for Suspension Ver PL with type
2 shock absorber.
for Suspension Ver PL with type
2 shock absorber.
1.4.5 Conclusions about shock absorber systems performance
The above laboratory tests were conducted to certify that EMAL® SA – Ermioni HSC seats comply with ISO® 2631 – Part 5 (2004) Standard’s rules for lumbar spine injuries in HSC. All of the above laboratory experimental tests, for Suspension Ver MIL with type 1 and type 2 shock absorbers and for Suspension Ver PL with type 1 and type 2 shock absorbers were successful. The possibilities for lumbar spine injuries after a long – term usage (45 years) of those HSC seats were far bellow the lower limit that ISO® 2631 – Part 5 (2004) Standard defines, with the highest shown value being at R = 0.22 (the lower limit is 0.5). Without specified HSC seats severe lumbar spine injuries may occur after years of exposure to vibrations and dizziness will appear after a few seconds of vibrations.
All experiments were conducted in Systems and Measurements Laboratory of the Electrical and Computer Engineering Department at University of Patras in June 2017.


Total test results are presented in the following diagrams.

Figure 5. Peak values of
acceleration in base platform, seat pad and lumbar spine response in z axis to
frequency, with low regression error ![]() for Suspension Ver MIL with type
1 shock absorber.
for Suspension Ver MIL with type
1 shock absorber.

Figure 5. Peak values of
acceleration in base platform, seat pad and lumbar spine response in z axis to
frequency, with low regression error ![]() for Suspension Ver MIL with type
2 shock absorber.
for Suspension Ver MIL with type
2 shock absorber.

Figure 6. Peak values of
acceleration in base platform, seat pad and lumbar spine response in z axis to
frequency, with low regression error ![]() for Suspension Ver PL with type
1 shock absorber.
for Suspension Ver PL with type
1 shock absorber.

Figure
7. Peak values of acceleration in base platform, seat pad and lumbar spine
response in z axis to frequency, with low regression error ![]() for Suspension Ver PL with type
2 shock absorber.
for Suspension Ver PL with type
2 shock absorber.